Candlesticks are a type of chart pattern used in the stock market. They are a visual representation of price movements and open and closed prices. If you are new to stock trading, you may not know many technical terms and charts, and it is of much important to know them to gather knowledge of any particular stock that you want to buy or sell or is following. One of the best methods to know the ups and downs of a particular stock over a period is to follow the candlestick.
You may be pretty surprised in listening to candlesticks on a trading platform. Well, they are not the ones that we light up to have a candlelight dinner or to celebrate our birthday. In trading stock the candle meaning is different. There are different types of candlesticks with their meaning that can be used to represent different trading patterns
Contents
Meaning of Candlestick
Candlestick meanings in stock trading refer to the charts for technical analysis of the movement of a particular stock, say for the previous six months, one year, and so on. One can get to know the opening prices, closing prices, highs, and lows of security by observing the charts.
The Japanese traders first used different types of candlesticks to have a sense of the stocks some hundred years ago, and today candlesticks are used by stock analysts to keep the traders informed about the movements. With different candlestick meanings, a trader can easily understand the market situation of stock and decide to buy, sell the particular stock, or hold on to the existing stock for better returns. It is time to discuss the types of candlesticks and their meaning for easy understanding.
15 Common Types Of Candlesticks And Their Meaning
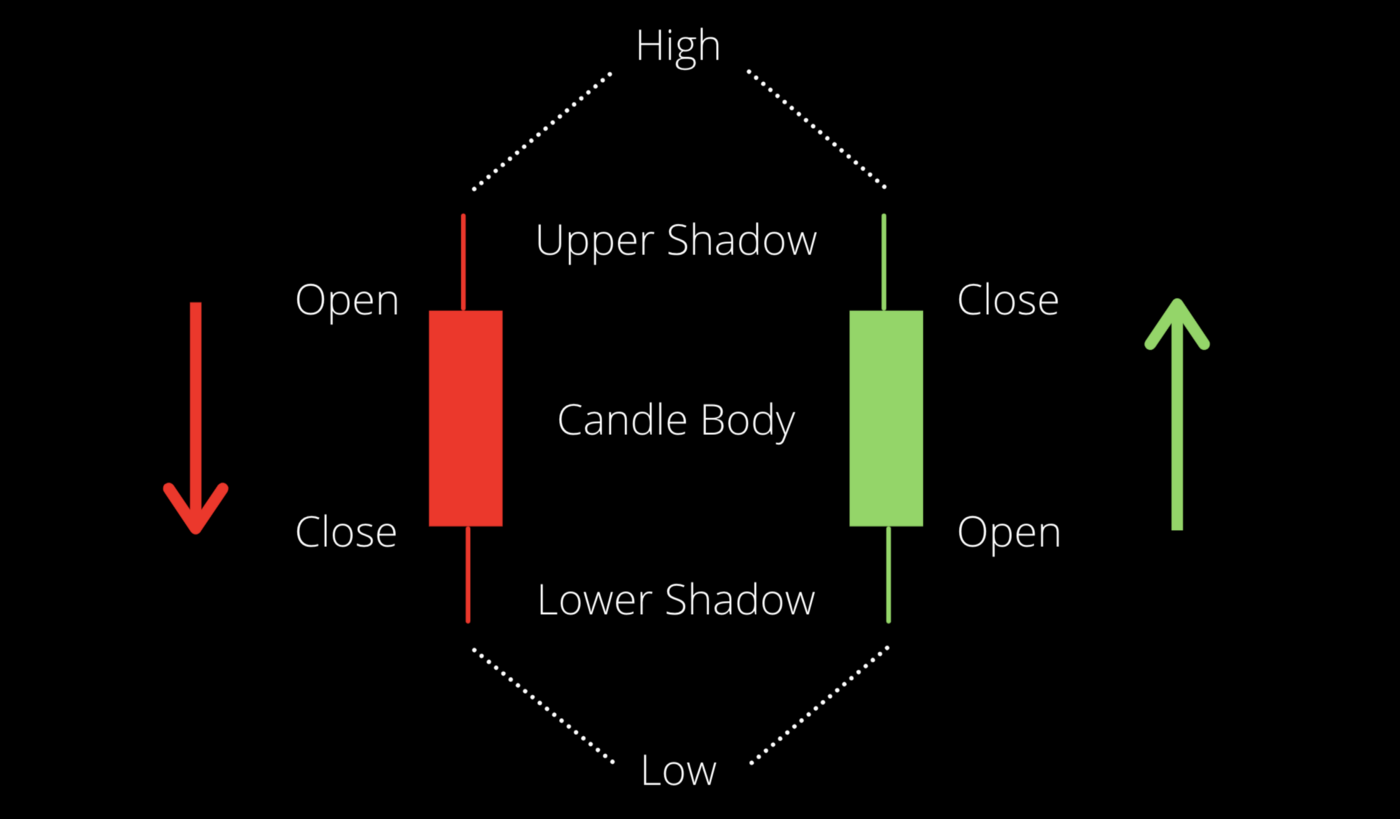
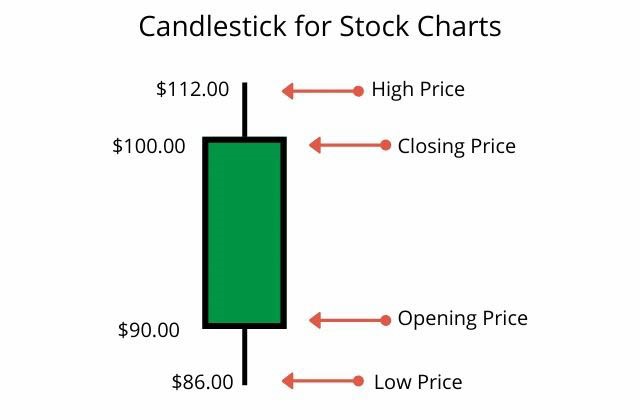
The shadows in the candlesticks represent the high and low prices of a stock on a particular day. It has the opening price, closing price, highest price, and lowest during the day. Again, the body of the candlestick is red or black if the stock closed at a lower price than the opening price, and it is green or white if it closed at a higher price. Understanding the candlestick meanings helps with proper technical evaluation, which is of utmost importance before investing in it or selling it.
In general, if the candlestick has a long length and is in the color white or green, one can say that the stock is in great demand in the market and is bullish. When it is reversed, and the color is back and red, one can make that the stocking is getting hammered and the demand for the stock is bearish. Basically, there are nine types of candlestick charts, and financial pundits subdivide them into many to get a better understanding and dig deep into the behavior of security in the market. Let us try to understand different candlestick meanings without subdividing more. One should master the basics to have control of their stocks and investments.
1. Big Candles:
When there is a significant price change in the stock in the market, the candlesticks are big or have more length. One can make out viewing the chart that a considerable price change has been there during the day in the opening and closing price either in a positive or negative direction. The color of the chart enables the viewers to understand if the stock is bullish or bearish readily. If the candles are small in length, it implies a minor change on either side.
2. The Doji:
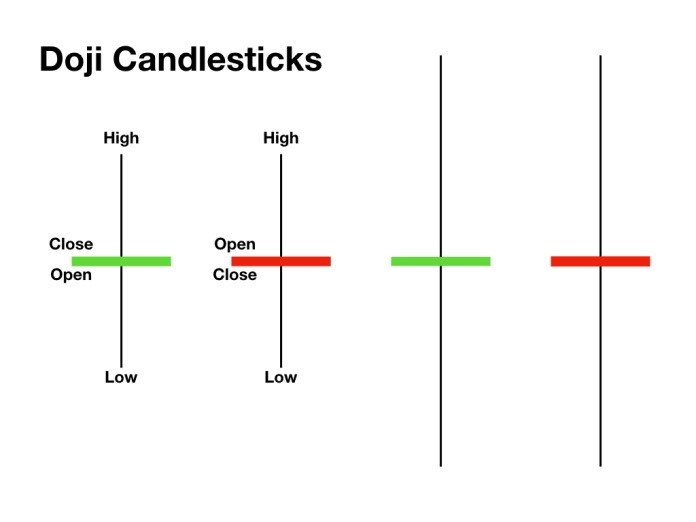
As discussed already, there are various types of candlesticks, and a Doji is one of them. The price of the stock may fluctuate during the day, but at the end of the trading session or closing of the market, there is no difference between the opening and the closing price. We can say that the market is uncertain, and there is confusion in the minds of the investors. It is both a win-win situation for the buyer and the seller during the entire trading session, but ultimately the stock held to the opening price during closing.
3. Dragonfly:
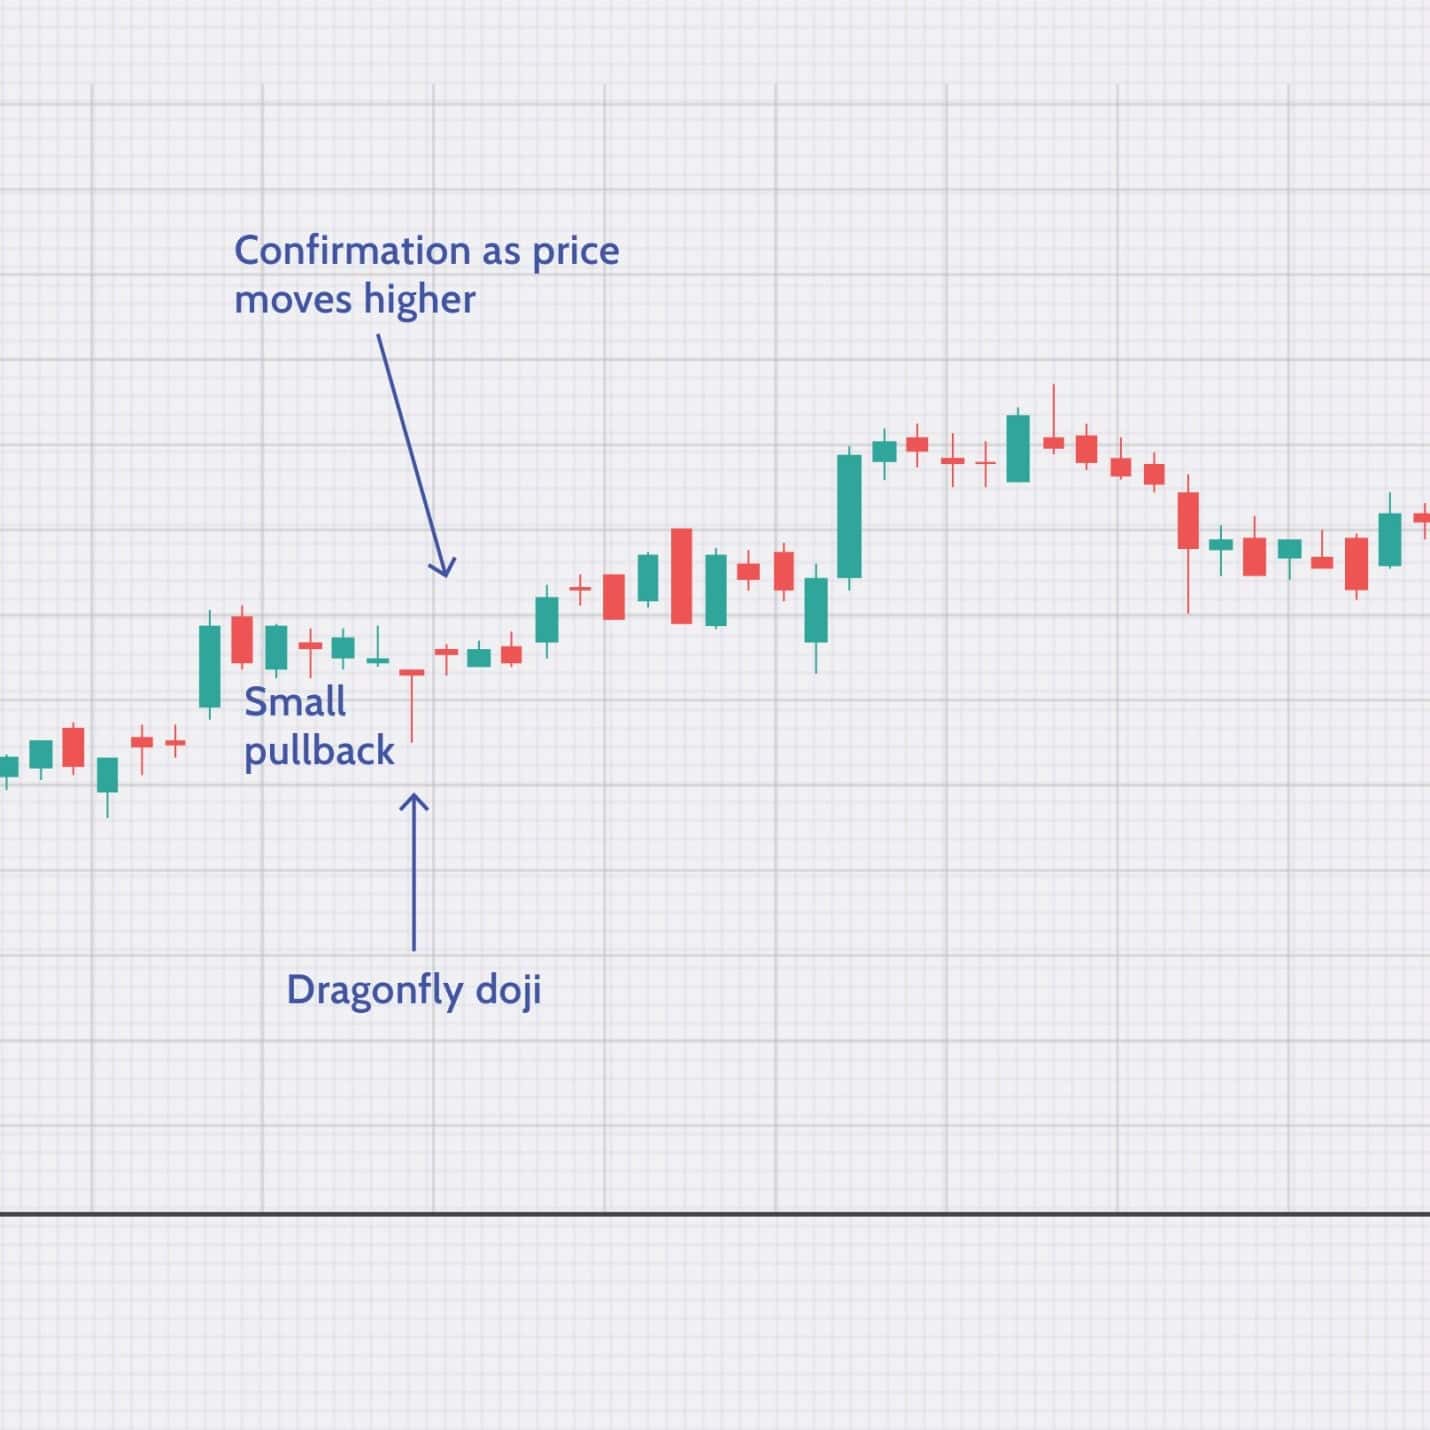
It is similar to the Doji, having the same opening and closing prices. However, it fluctuates in a single direction, either in a decreasing direction or in an increasing direction. Still, the stocks maintain the same opening and closing price at the end of the day. It cannot give a clear picture of the stock, but Dragonfly, in combination with other types of candlesticks, becomes an essential tool for market analysis.
Also Read: Wall Street Cheat Sheet
4. Gravestone:
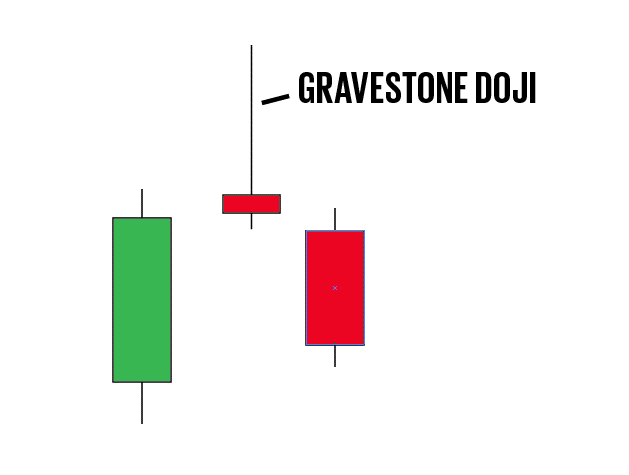
It is also like the Doji having the same opening and closing price. It indicates the reversal of the bearish market trend and fluctuates in a single direction, either in the decreasing direction or in the increasing direction. Still, the stocks maintain the same opening and closing price at the end of the day. One can expect that the stock will bounce back in a positive direction. However, this chart is unable to give a clear picture of the stock, but Gravestone, in combination with other charts, can become a vital tool for analyzing the market.
You may like: 15 Stock Market Trading Patterns Cheat Sheet
5. The Morning Doji Star:
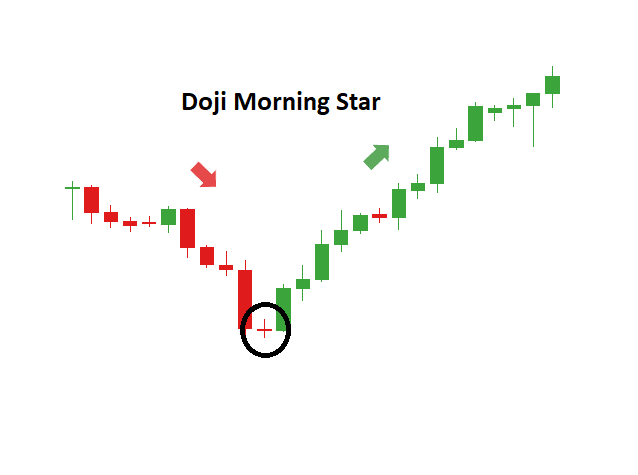
This candlestick is helpful to gauge the reversal of the market trends of a particular share. For example, if the candles move down and hit a point in the Doji and then move upwards, it is known as the Morning Doji Star. However, seeing a single chart does not help an investor whether to buy a specific stock or ignore it. However, as an investor, if you have made up your mind to buy a particular stock, this pattern will help you when to buy the stock at a specific time during the day. One should be able to identify the pattern of the Morning Doji over a period to take entry into the market for buying a particular stock. Look at the smallest candle in the chart. It is when the reversal of the trend is beginning and the right time to buy the stock.
6. Evening Doji Star:
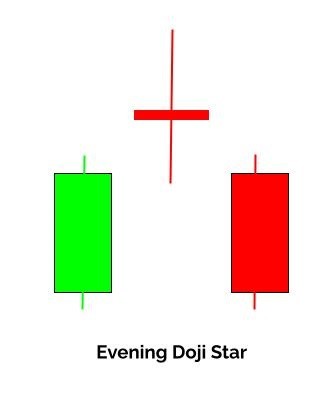
Again, if the stock moves upward and then returns to the initial Doji or goes down, the chart is termed the Evening Doji Star. One should follow the chart’s pattern, make decisions on their investments, and manage the portfolio accordingly. If you are rigid on buying a specific sock, this chart helps you understand the right moment of the day to make the investment. The reversal happens when the candle is the smallest in the chart, and it is the ideal time to make an investment.
7. Bullish Harami:
When a large candle is followed by a small candle and contained in the body of the first candle, one can observe this pattern. The Bullish Harami signifies an upward trend. Following the pattern, one can predict that the present situation of the stock will reverse. Be sure that in most cases, the stock is changing direction shortly. Remember, when a particular stock gets exhausted in the market, the prediction is that the sellers have taken control of the market and the stock has got exhausted reaching a specific price.
8. Bearish Harami:
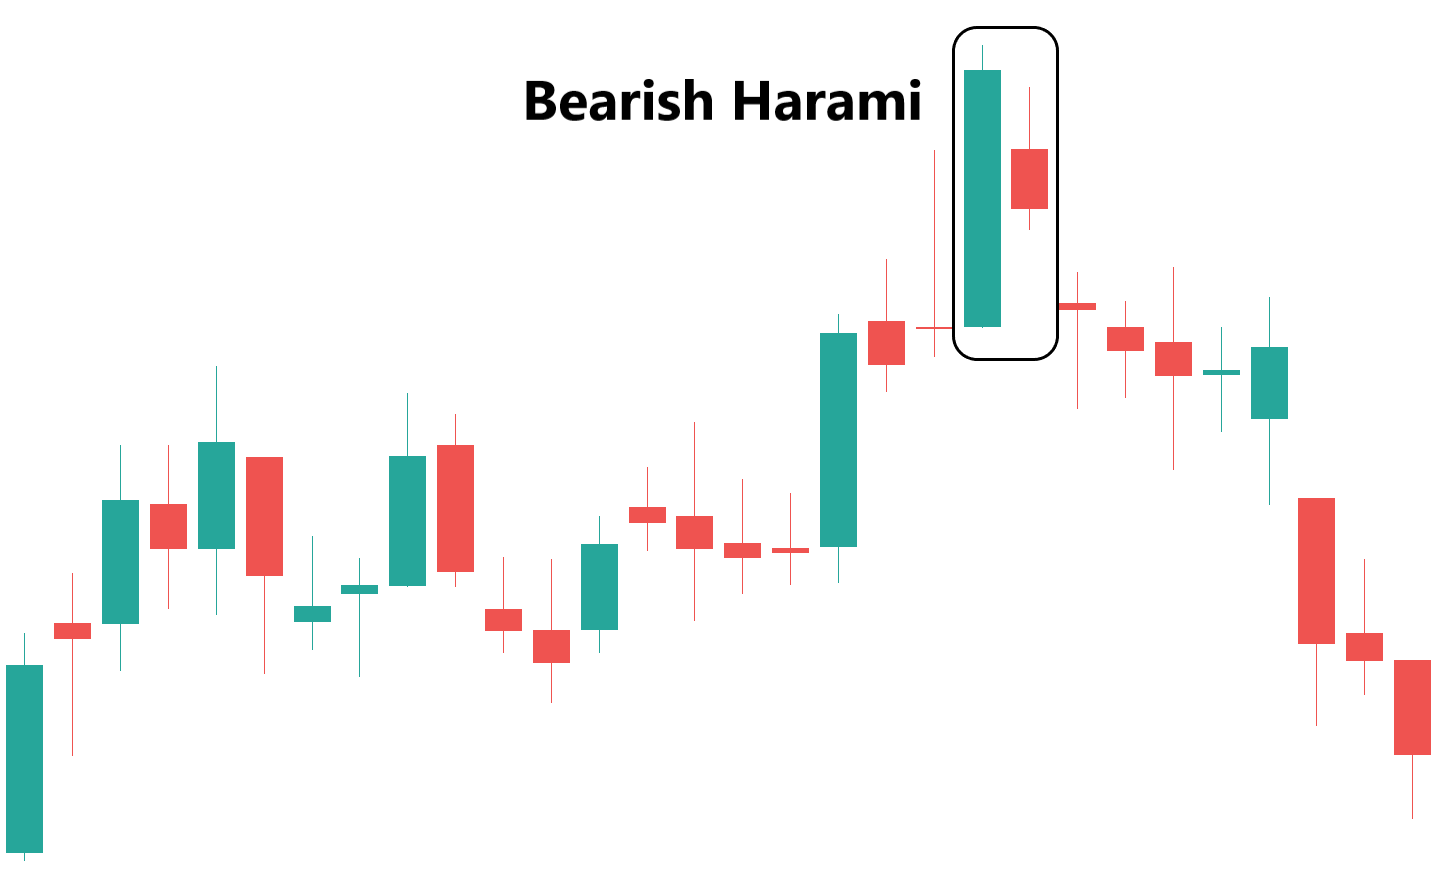
The Bearish Harami is just the opposite of the Bullish Harami. It indicates the downward trend of the stock. It suggests that the market is no more bullish. Watching the patterns and using other technical indicators like the stochastic oscillator or the RSI (relative strength index) can increase the chance of trading successfully in the market.
Also Read: How to Start Day Trading With $100
9. Hammer:
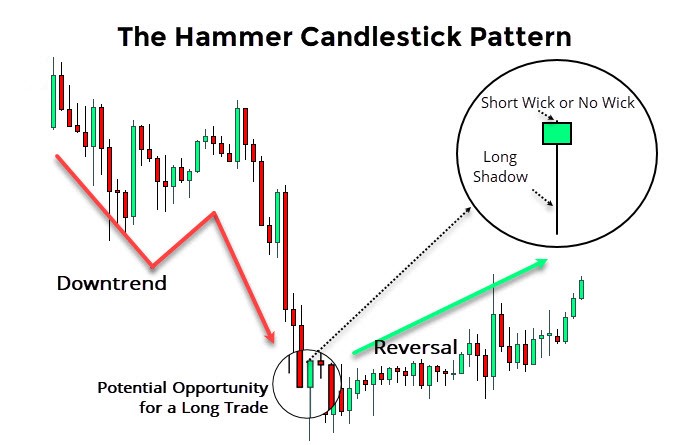
In the hammer chart, the stock’s opening price gets hammered and comes down. If the chart is like a regular “T,” it represents the market is bearish. The opening price is the point of the hammer, and then the price remains minimally below the opening price. It is somewhat similar to the Dragonfly candle.
10. The Shooting Star:
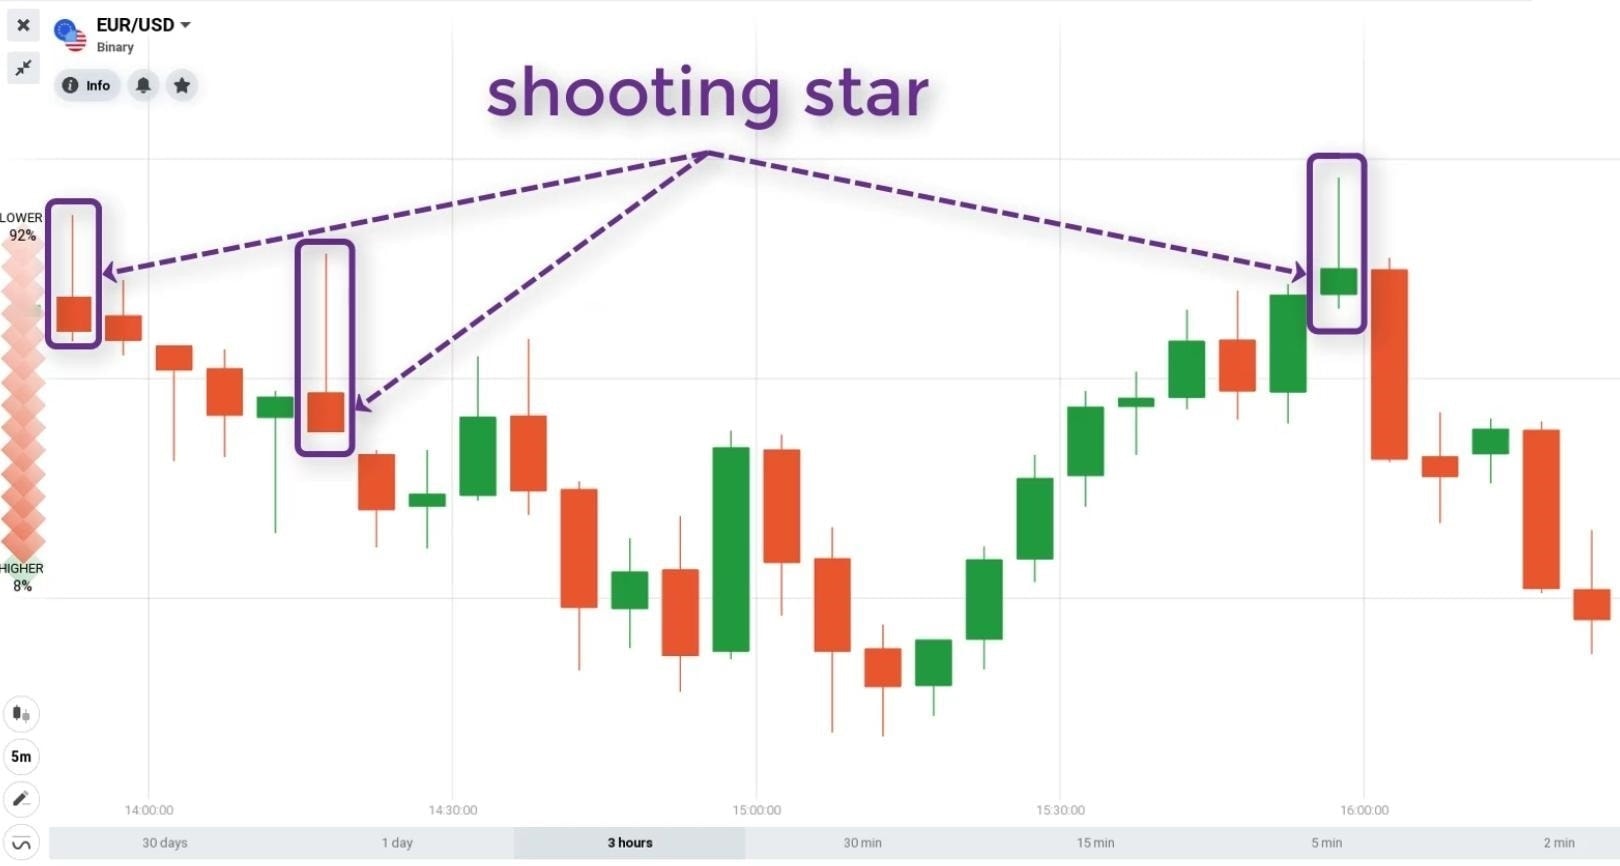
Again, the Shooting Star candle is observed when the stock’s opening price moves up and ultimately comes down but stays minimally over the opening price. The chart design is like an inverted “T.” We can say that the stock is bearish observing this type of chart. The stocks are controlled by the sellers in this type of market situation. This candle is more or less identical to a Gravestone candle.
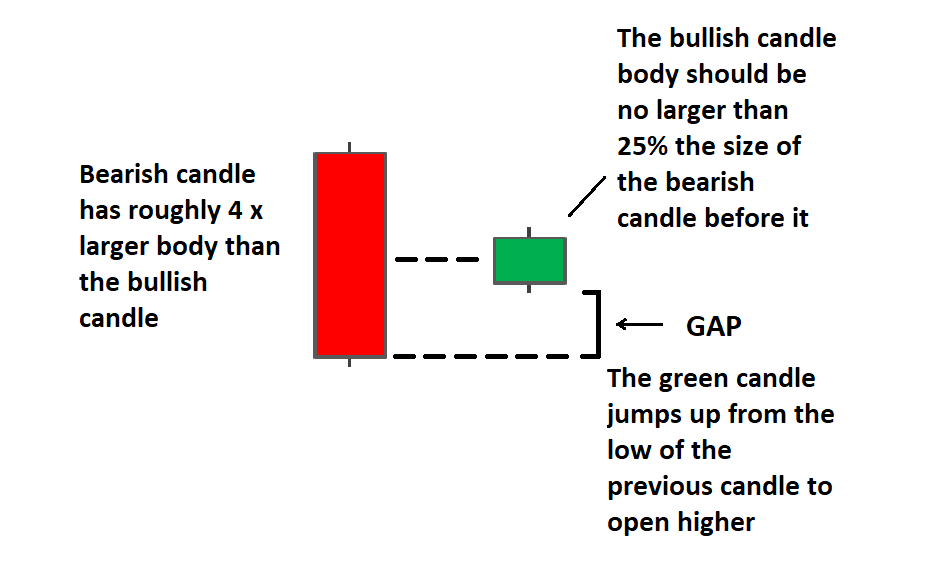
11. Engulfing Bearish Chart:
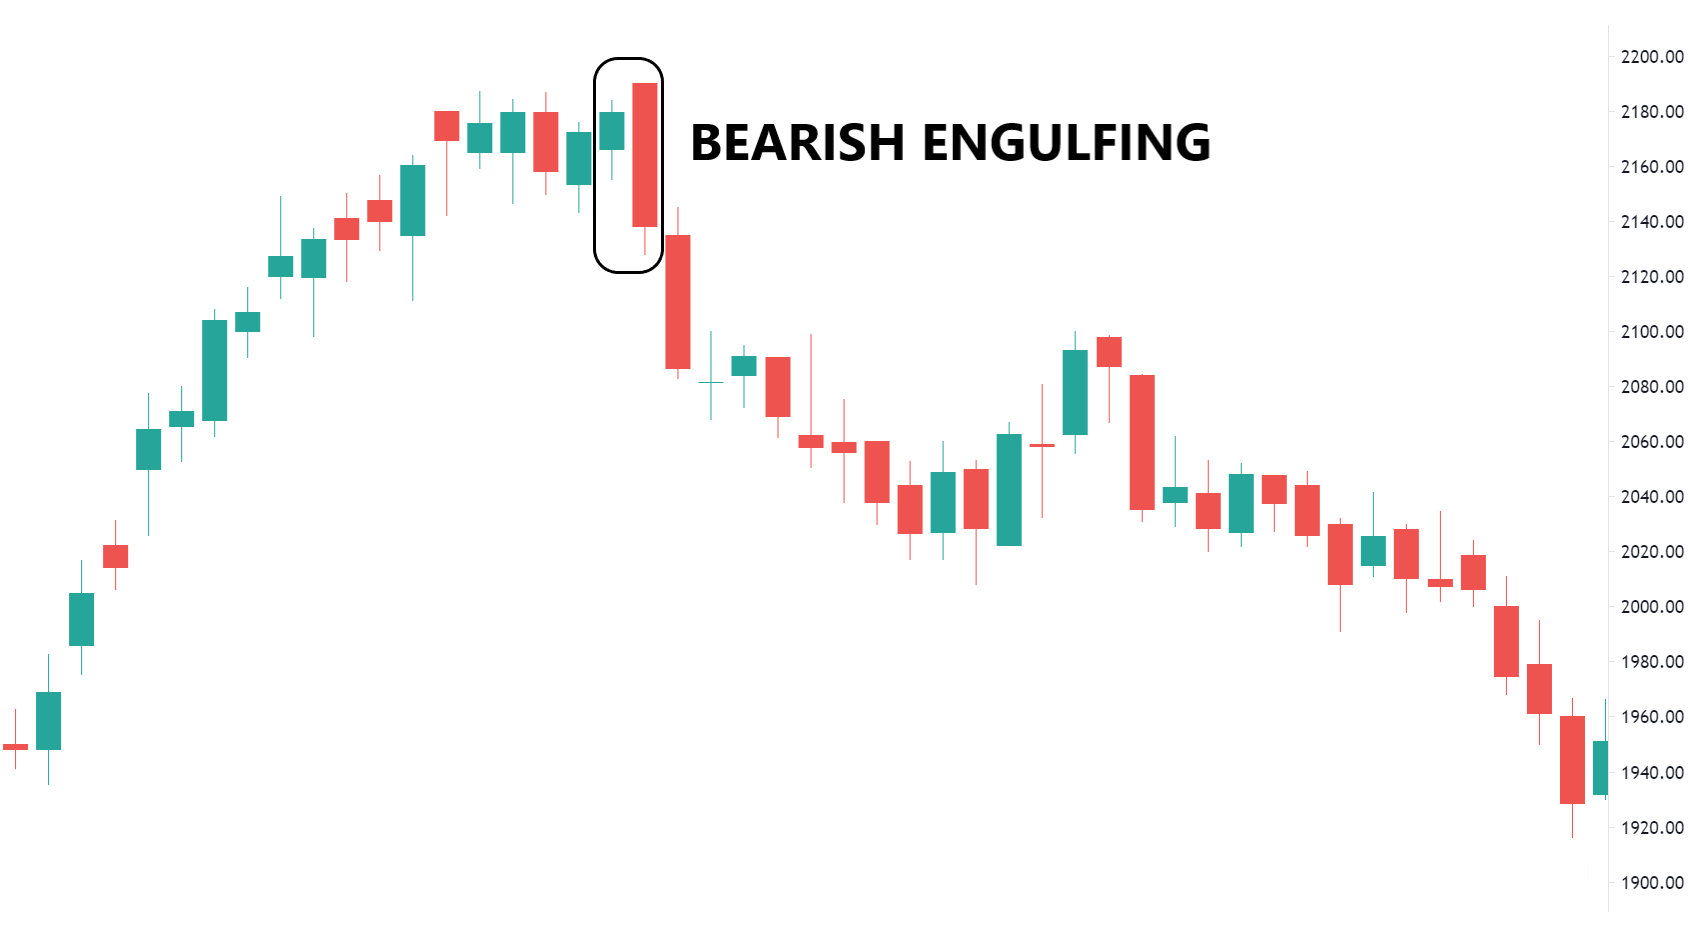
In the engulfing bearish candlestick, we get to see a big candlestick following a small candlestick. As the buyers get interested in a stock, the price of the stock increase, but after reaching the peak, we observe a red candlestick engulfing the green one. It means that the trend is reversing due to the substantial interference of the sellers.
12. Engulfing Bullish Chart:
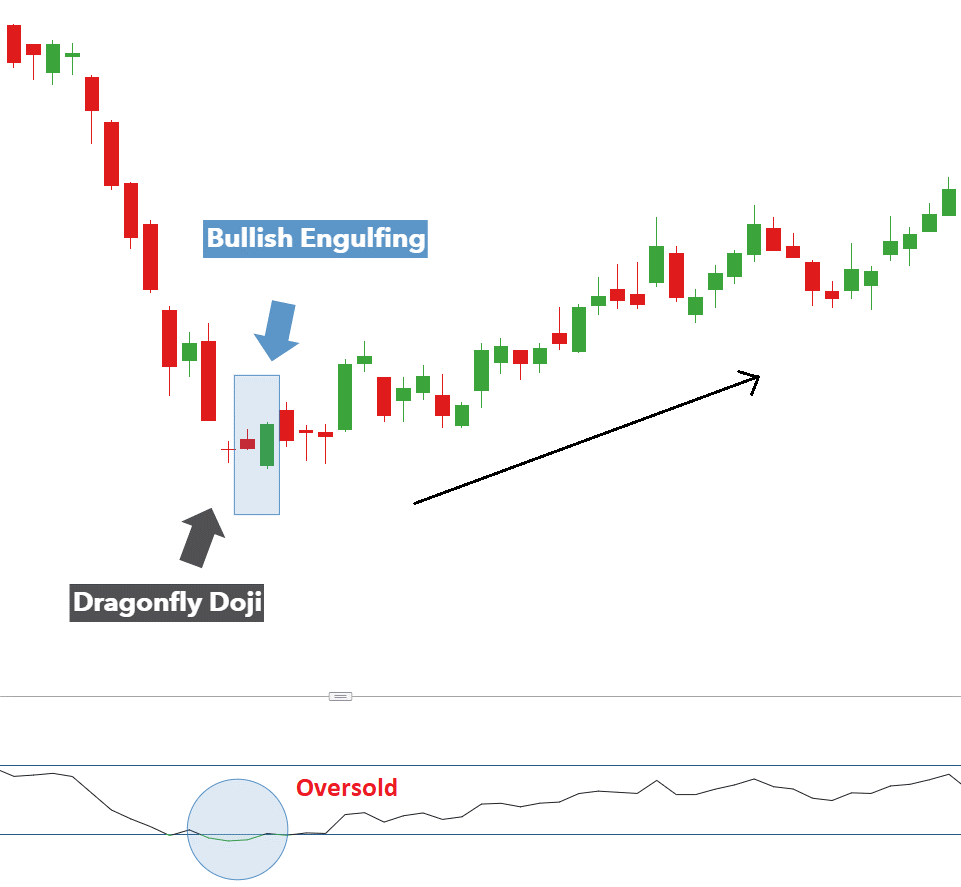
However, in the engulfing bullish candlestick, the large candlestick overshadows the black or red candlestick. When the trend is downwards, this type of candlestick chart is visible, signaling that the market is bullish for a particular security and the prices are going upwards. One should observe the chart carefully, and if there are four or more black patterns, the market will reverse. One should look for two bullish candlestick and their predecessors and decide on the stock.
13. The Piercing Chart:
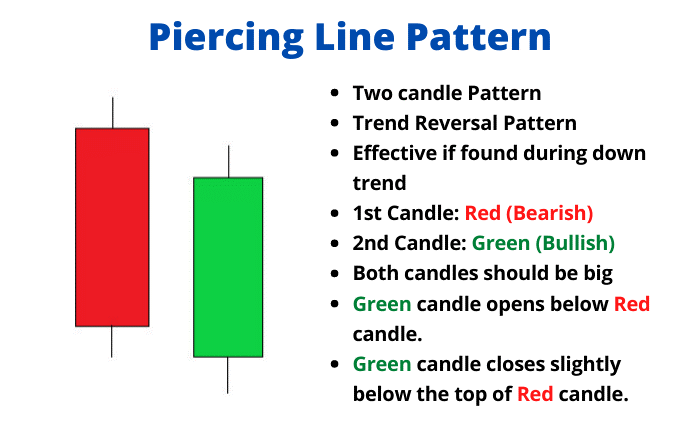
This type of candlestick chart includes multiple charts inside one chart. This candlestick is obtained when the stock price takes a downtrend, indicating that the market will be bullish soon. There are two candles, one signifying the bearish market will continue for some time. The other candle suggests that the bulls are active in the market, and the stock will bounce back shortly.
14. White Marubozu:
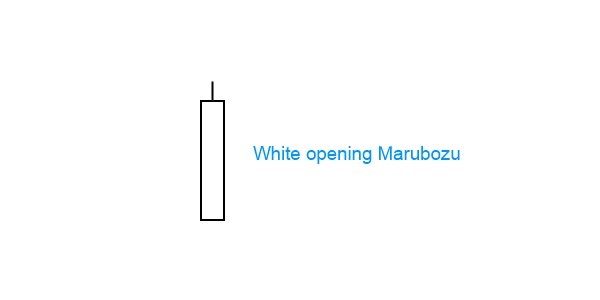
It is a single candlestick chart that comes into existence indicating a bullish reversal after a downtrend. There are no shadows in the upper or lower part of the chart, and the stock is under buying pressure. The bulls control these types of stocks.
15. Tweezer Bottom Candlestick:

The candlestick is formed, indicating a reversal in the stock trend and the end of a downtrend. As the name suggests, there are two candlesticks with the first stick as bearing and the second as bullish. Just before the downtrend, both the candlesticks are at the same low or almost run at the same levels.
Investors prefer to view the candlestick charts over the line charts, and through the former, one can get more details about the security price. Through a line chart, it is possible to determine how much the price is swinging in favor or against, but it is impossible to know how it happened. Through a candlestick chart, one is able to observe how the prices swing in either direction. One can follow every detail of how it happened through the candlestick chart and make the right move.
Conclusion
Interpreting the stock candle meaning enables an investor to understand the behavior of the stock in the market. The candlestick chart helps predict the market situation with particular stock over a period or in a day and takes decisions on buying or selling any specific security. One can also go for the sub-branched candlesticks under each category. Still, they are not that important unless one is a financial pundit analyzing the market and digging deep into the stocks.
It is time to understand the market sentiments without any third-party help, trade with much confidence, and reap the benefits. Some knowledge of the line chart and candlestick chart helps the investors gain knowledge of the trading process.
You May Also Like:
- How and Where to Buy Doge Killer Coin
- Where and How to Buy MIR Coin
- Where and How to Buy Satoshi Coin
- 10 Cheapest Penny Stocks on Cash App Under $5