The trading patterns cheat sheet is essential for every buyer and seller dealing with the stock market. It shows the status of the stocks in the market. Hence, they must print the trading pattern cheat sheets and keep them handy so that they can study the latest trend of stocks and shares in the market. This cheat sheet includes the most common stock market trading patterns and how they typically behave over time. It also provides some tips on how to trade these patterns in order to maximize your profits.
Stock market trading patterns cheat sheet is usually used by traders, investors, and analysts to make trading decisions. The patterns are based on different market indicators and historical data. Traders use these patterns to determine which stocks or indices to buy or sell in order to maximize their profit potential. Investors use them in order to identify the best stocks for their portfolio and analysts use them as a guide when they need to do research on a certain stock or index.

They will be able to analyze the price and market trends in the financial market. It also helps the buyers and sellers check the ups and downs of the shares and the exact point where the stakes are likely to move up. There are various types of trading pattern sheets that we can use.
Below I have listed the 15 most common types of stock market trading patterns cheat sheets:
Contents
15 Stock Market Trading Patterns Cheat Sheet
1. Head and Shoulders:
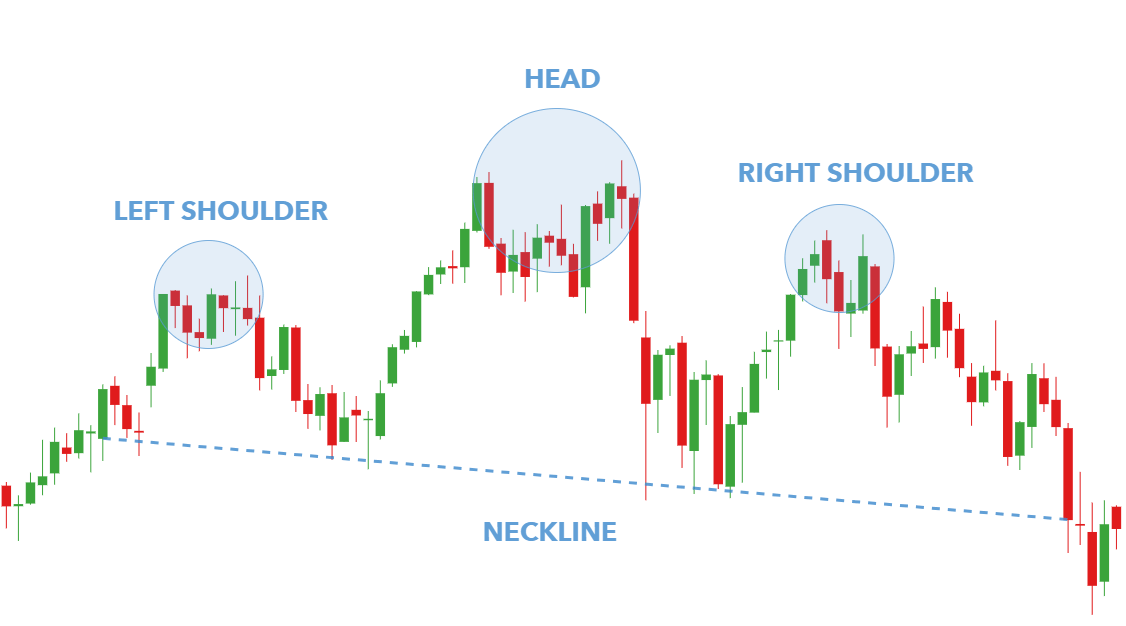
This pattern sheet is the most reliable trading patterns cheat sheet. It gives up accurate information on the market trend of stocks and appears as the baseline with 3 peaks where the middle peak tends to be the highest. With this pattern sheet, you will predict the bullish to bearish trends of the stocks and shares. It forms when a stock rises to its peak and again declines back to its position. The first and third peaks represent the shoulders, while the second peak, the highest, represents the head. It is never accurate as some price fluctuations between the shoulder and the head. The pattern is favorable to the traders as they can determine the price targets once the pattern is complete. It is essential for traders not to make trades until the construction of the design, and it is because there can be a change in the design due to a fluctuation in the market. Hence, do not start trading thinking that the pattern will form if you see a pattern formation.
2. Double Top:
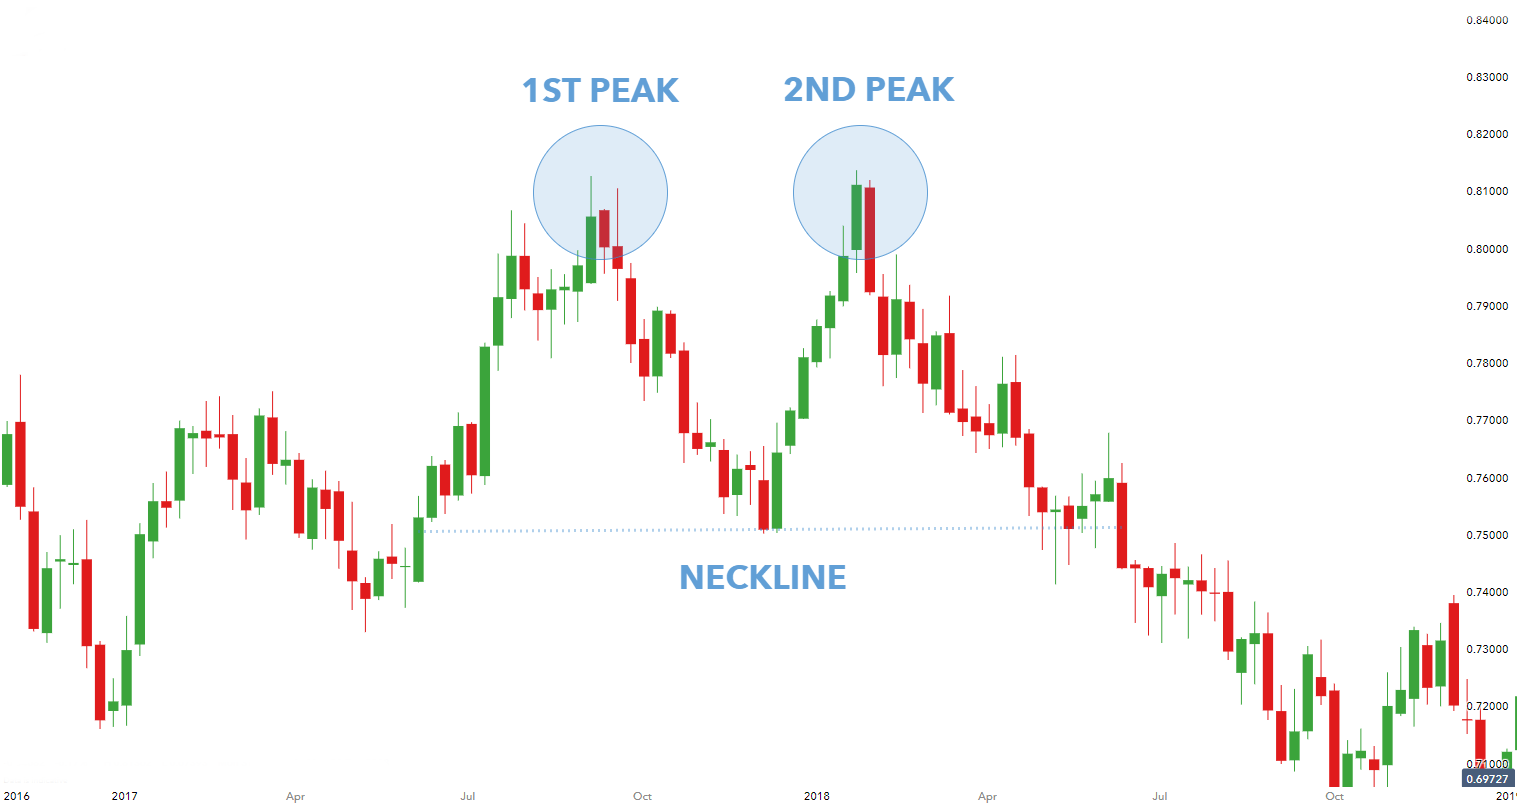
The double top stock pattern cheat sheet is a market trend that highlights trend reversals. A bearish technical reversal pattern forms after an asset reaches a high price twice, with a slight decline between the two highs. Usually, a double top stock pattern cheat sheet specifies a considerable asset class, showing a sharp decrease in the price of stocks or shares in the market. A double top determines a reversal pattern of the prices of shares or stocks. The tops are the highest peaks when the price hits a level. However, after hitting the high, the securities’ costs bounce back and return to their position. The bouncing back of the price to its initial position is called Double Top. When there is a double top, you must place the entry point below the peak as there is an anticipation of a reversal of prices. Traders, while trading, must spot whether two rounding tops are forming along with the size of the tops.
3. Double Bottom:
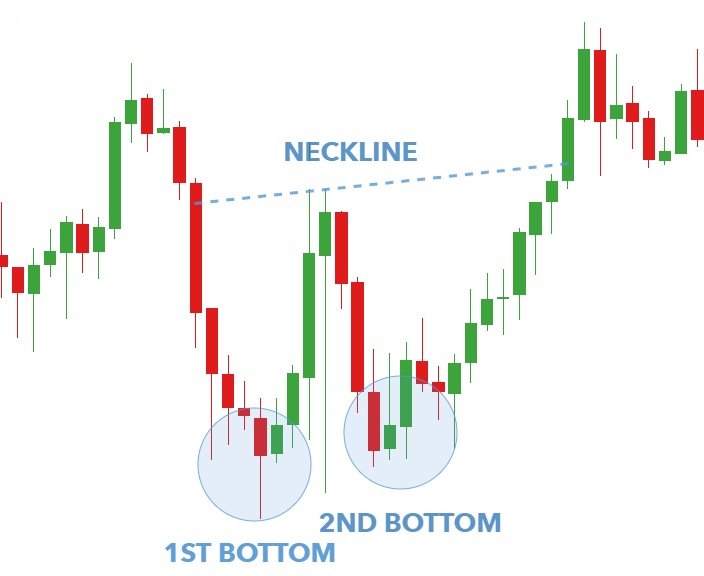
A double bottom stock cheat sheet also determines a bullish reversal pattern as though it shows a downward trend; there is a considerable shift upwards. A double bottom stock cheat sheet indicates a low asset price change in the initial stage. However, it is temporary as there is an upward shift in the prices of stocks and shares. The double bottom looks like the letter ‘Was there a rebound in the claims costs? Ultimately, in the end, there is a considerable shift of the shares or stocks in the upward direction. A double bottom cheat sheet is best for analyzing the longer view of the stocks and shares market trend. If the duration between the two low shifts is longer, the success rate is more.
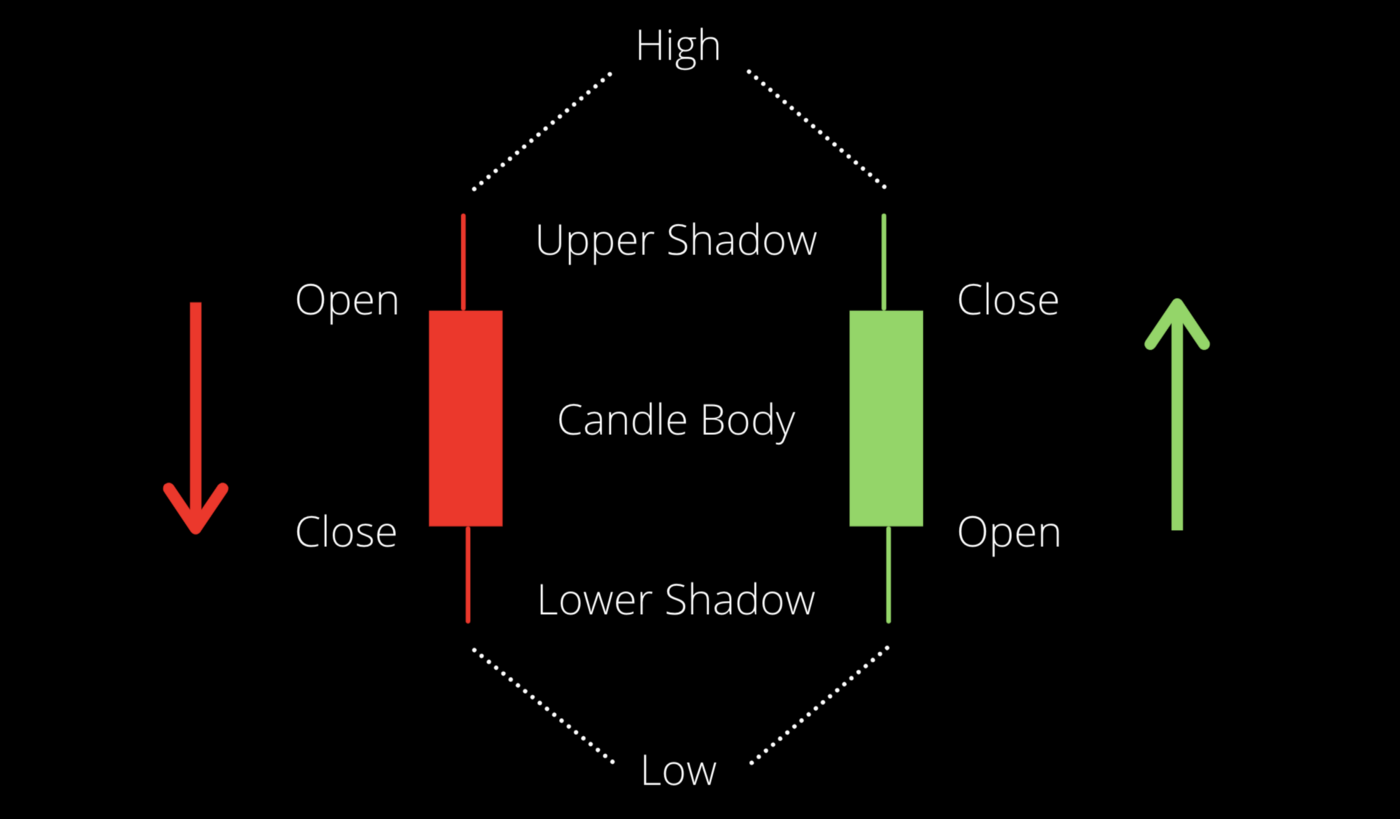
Also Check: Types Of Candlesticks and Their Meaning
4. Rounding Bottom:
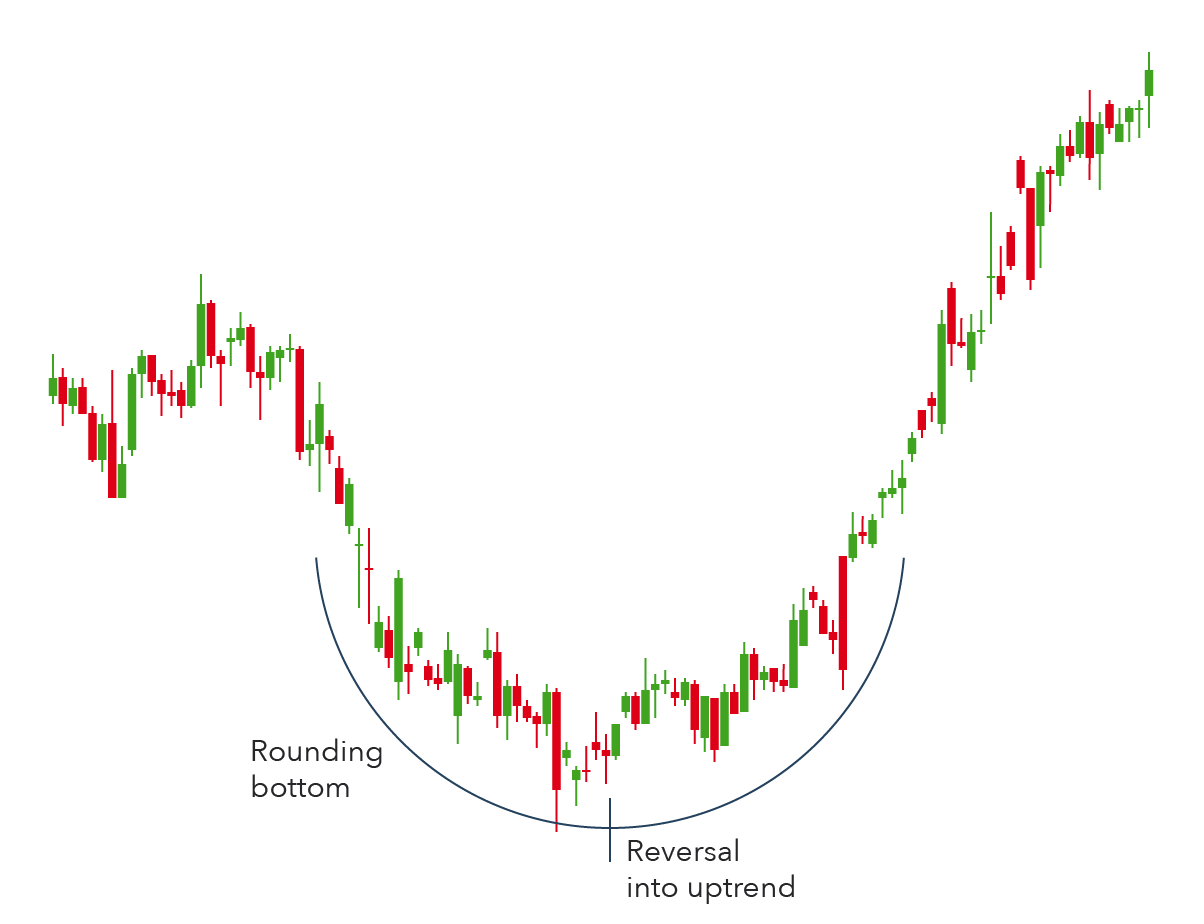
A rounding bottom stock cheat sheet signifies a reversal from a downward to an upward trend of the prices of the stocks and shares. It is a classic example of a bullish reversal trend as the rounding bottom indicates that there will be a considerable rise in the prices of shares and stocks. When traders see the rounding bottom of the stock cheat sheet, they will start buying the stakes as it indicates a rise in the price of shares of stock in the future. The round bottom of the chart suggests that the costs of shares of stock will transform from a bearish bias to a bullish bias. There will be an initial low in stocks and share prices, but ultimately it will rise.
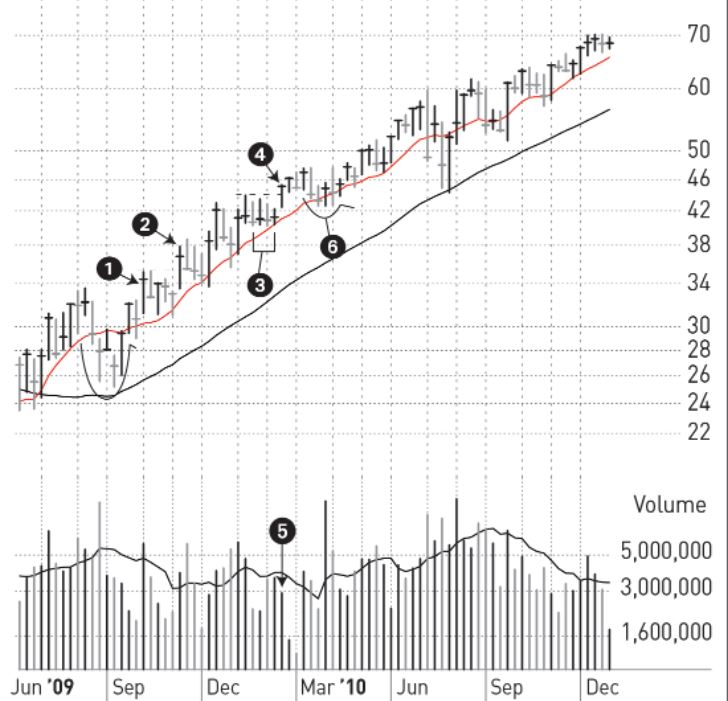
5. Cup and Handle:
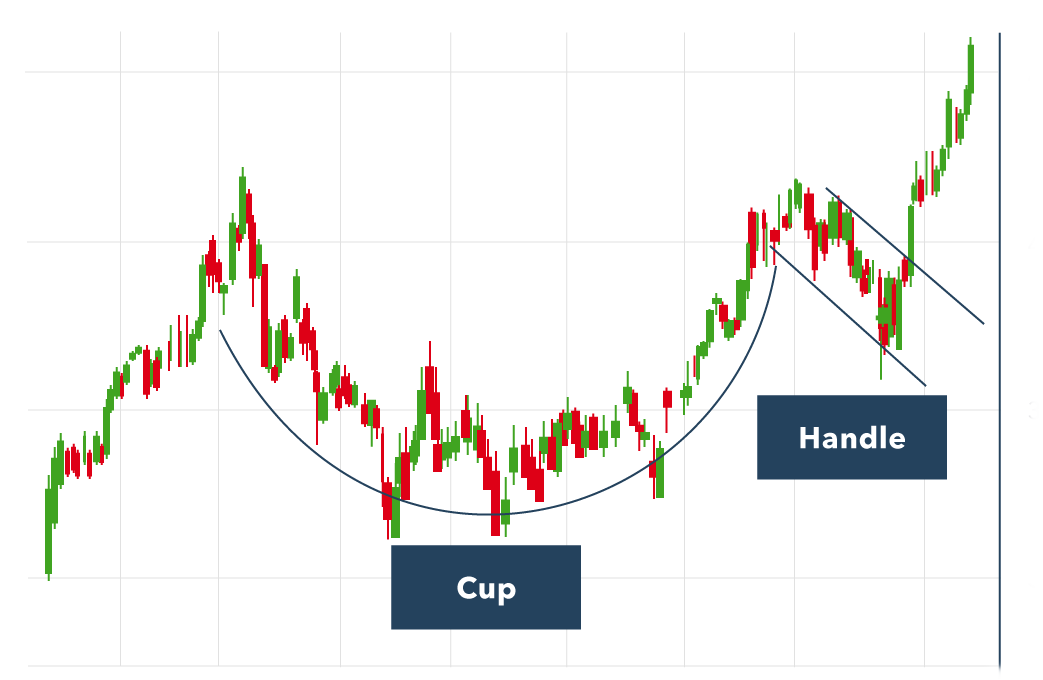
The Cup and Handle is a chart pattern cheat sheet that indicates a bullish trend in the market prices of stocks and shares. It is similar to a rounding bottom, except the handle signifies a specific direction of the shares and stocks. It appears in small time frames; hence, you can use the Cup and Handle design if you want to know the stock market’s cheat sheet day trading patterns. Traders usually follow the trend of the cup and handle pattern sheet to go for a long investment in the shares. It occurs when there is a downward shift in the shares and stock prices in the financial market. The prices of the shares stabilize at a certain point before shifting sideways or moving downwards, forming the shape of a handle. If the shape of the handle dips further toward the bottom of the cup, it is advisable not to trade it as there will be a loss.
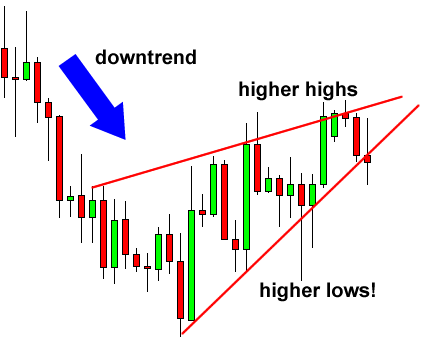
6. Symmetrical triangle:
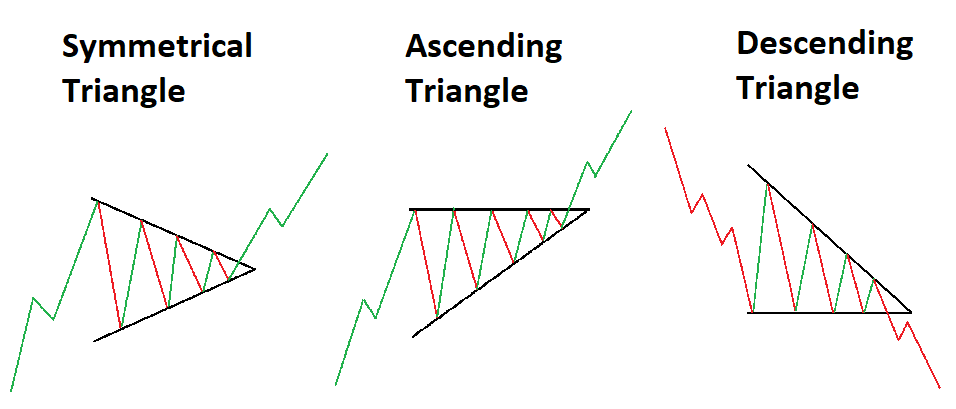
The symmetrical triangle cheat sheet pattern signifies that there are usually two highs and two lows in the prices of the shares and stocks in the market. When the two lines converge at both ends, it signifies a symmetrical triangle. Once the pattern is in the shape of asymmetry, it will indicate the market prices of the shares and stocks will continue in the same direction for a considerable period. The symmetrical triangle shapes when there are a series of low prices followed by an upward shift in the shares and stocks in the market. However, if there are no indications of the formation of the triangle, it can signify a break in the market. It can move in any direction.
7. Ascending Triangle:
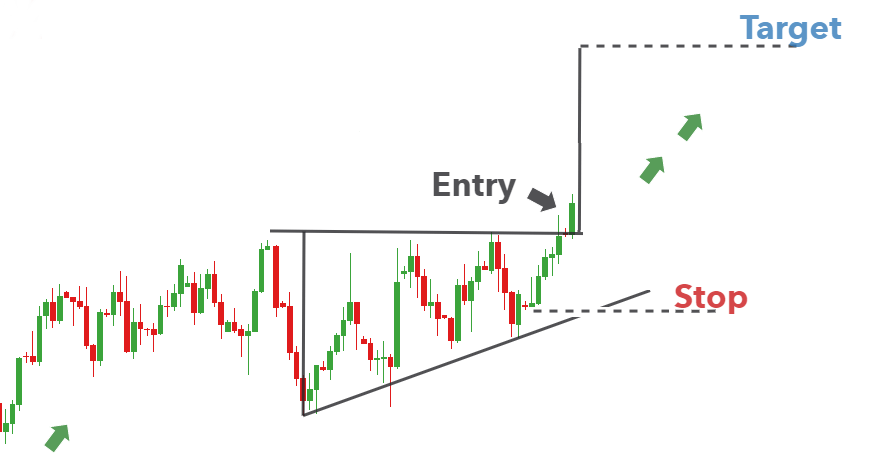
You can describe a bullish chart pattern as an ascending triangle cheat sheet. There is an upward trend in shares and stocks in the financial market. Since the two lines converge, both don’t need to have the same price level. However, the prices are more or less close to each other. Usually, an ascending triangle takes some weeks to form, however, they do not last for more than ninety days. The ascending triangle takes the shape of a right angle, thus allowing the upward shift in the prices of shares and securities. It indicates that the market is moving higher toward the resistance line. The cheat sheet of the ascending triangle suggests the strength of the bulls who are willing to pay more for the prices of the stocks.
8. Descending triangle:
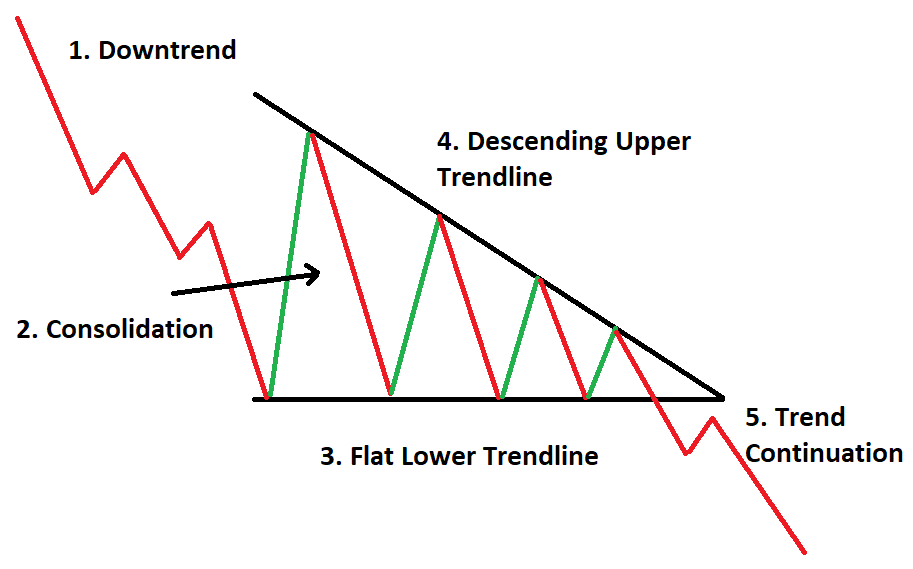
A descending triangle cheat sheet pattern is like a horizontal straight line that connects a series of lower highs with a series of lows. It is a bearish formation that forms during a downward trend in the prices of shares and stocks. A descending triangle cheat sheet can be for a few weeks or months. A descending triangle cheat sheet pattern signifies that sellers dominate the market, and hence it is unlikely that there will be a sudden change in the market trend of the shares and stocks in the financial market. A descending triangle can take the shape of a right angle. It is formed in the downward trend and further signifies a downward continuation. There is a prior downward trend to a certain point where the horizontal line supports, indicating that there will not be any further downward trend in the price. The advantage of the descending triangle is that traders can identify the target level quickly and invest accordingly.
9. Flat Base:
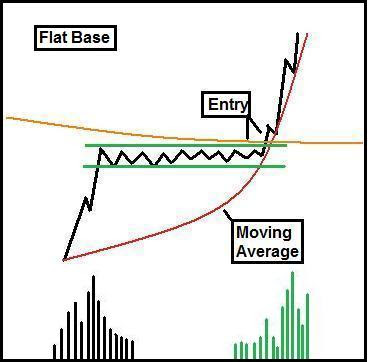
The Flat Base trading cheat sheet is a classic example of multiple opportunities to make money. A flat base is like a second stage basis as they occur again from the cup and handle and double bottom trading pattern. They form a flat base when the stocks and share prices move sideways from the cup-handle and double-bottom cheat sheet patterns. It is not suitable for weaker investors as they gradually wear out of the market. Since the upward shift in the stocks and share prices is slow, more vulnerable investors lose patience. Ultimately, they sell their shares on the stock exchange.
Also Read: How to Start Day Trading With $100
10. Bearish and Bullish Rectangle:
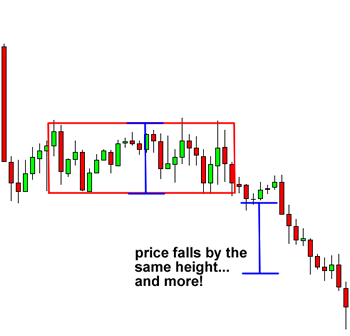
A Bearish or Bullish rectangle pattern cheat sheet occurs when there is either a downward or upward trend in the prices of stocks and shares. It is a point where buyers and sellers do not have the option to dominate the market. During a Bearish rectangle, patterns form when the price becomes stable for a while and then starts its downward trend. It usually happens when sellers typically stop for a time before continuing with the market trend. On the contrary, a bullish rectangle pattern shows a rise in the price of the shares, and it remains stagnant for a while before it moves.
11. Pullback:
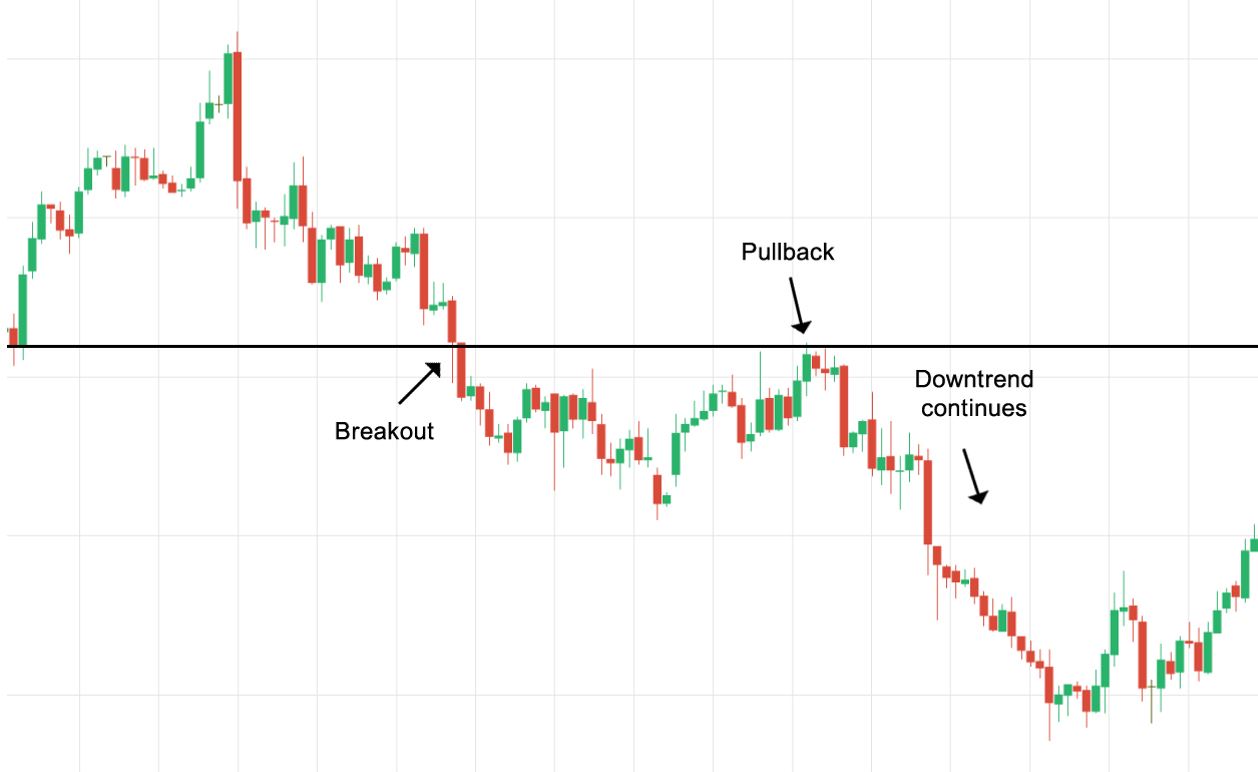
The Pullback pattern cheat sheet of the shares gives you all types of trading opportunities as there is an increase in the price of the securities. It may look easy to profit when the pullback pattern cheat sheet influences the prices of shares and stocks. However, it is harder to make a profit in the real world. It is, in a way, a risk that the investors take, and hence it is favorable in the long run. However, it would be best to observe the market trend before making a final decision. During a pullback, there is a temporary drop in the prices of the securities. It is a common phenomenon in the bull market. The quick decline is usually due to the supply and demand of the shares. It happens when buyers are unwilling to pay for the price rise of shares. Eventually, the demand for the shares drops considerably. As a result, the prices of the shares also start to drop. The low cost of the shares then attracts buyers, who start investing in the shares.
12. Square box:
The square box chart pattern is the latest in the financial market. It only takes about four weeks to form but does not exceed more than seven weeks. One of the best examples of cheat sheet day trading patterns is the square box. It is helpful for beginners as the price neither soars higher nor drops considerably.
Also Read: Standard Wall Street Cheat Sheets
13. Wedge:
A wedge represents a line that will signify that the asset price in the share market will gradually decline permanently. There are two types of wedges; the one that is upward rising will fall progressively down forever. The falling wedge indicates that the share price will increase, breaking all resistance. A rising wedge occurs when the price consolidates between the upward slope and the resistance lines. The slope is usually steeper than the resistance, which indicates a quick formation of higher lows than higher highs. It ultimately takes the shape of a wedge. As the price consolidates, it means a break-out either at the top or bottom. However, if there is a downtrend, it will indicate that the prices will continue to move down.
14. Pennant:
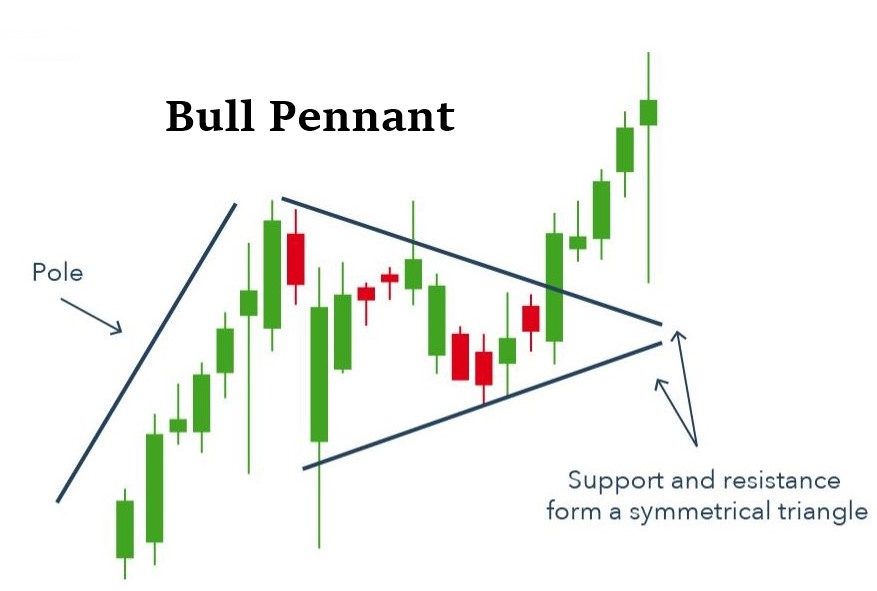
The Pennant patterns happen when there is an upward shift in the price of the shares and stocks. Usually, there is a price rise in the initial stages, after which there are small up-and-down movements. Pennant can be bearish or bullish, and there can be a complete reversal of the share prices. Hence, there is a significant upward-to-downward movement, and it continues in the same direction. Depending on the direction of the movement, you will specify whether it is bullish or bearish.
15. Flag:
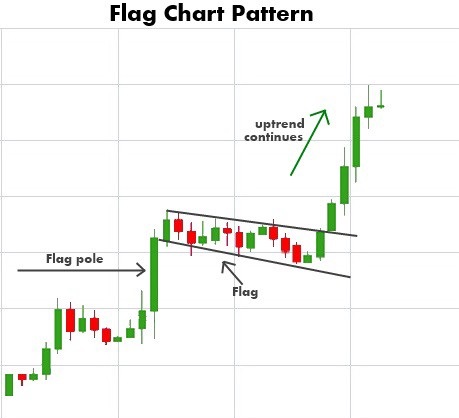
The Flag pattern is like a sloping rectangle, and the lines run parallel until there is a break-out. The break-out represents the prices in the opposite direction. The flag pattern is not favorable for buying and selling shares and stocks. There are two types of flags; the bull flag and the bear flag. Both are identical, except there is a downward trend in the bear flag. The most important feature of trading with the help of flag patterns is the volume. When the volume is high, it is most likely that most traders will jump into investing as the success rate is higher.
Conclusion
The stock cheat sheet pattern signifies how you can invest your money in the stock exchange. The design of the charts signals the upward or downward shift in the prices of shares and stocks in the financial market. It is a beneficial indicator for buyers and sellers who deal with the stock market. Hence, it is advisable to understand the market trend before investing in shares. You can do so by studying the various types of cheat sheets that can indicate the market trend of the prices of stocks and shares on the stock exchange.
Post You May Like:
- Use the CCI Indicator in Forex Trading
- Cheapest Penny Stocks on Cash App
- Calculate Equity Dilution for Startups